on
The membership of Lancashire libraries
Lancashire libraries were one of the first services to volunteer for a library storytelling project, as well as suggesting areas of their data they’d like to explore. One of these was library membership and usage.
Lancashire and its libraries
Lancashire is a county in North West England. The name can refer to different things and we shouldn’t confuse the ceremonial county with the county council. Lancashire County Council is one of 3 ‘upper-tier’ local authorities within the ceremonial county, alongside Blackburn with Darwen, and Blackpool.
The population of Lancashire County Council is about 1.2 million and the libraries serving that population are Lancashire libraries.
Lancashire libraries deliver statutory, front-line library, information and digital services to communities from 64 buildings, 6 mobile library vehicles and through a Home Library service. They offer a free Digital Library including eBook, eAudio, newspaper and magazine download service. Public computers and WiFi are available without charge in all buildings. A library service is delivered at 5 Lancashire prisons. The School Library service supplies subscription-based reading and library services to primary schools, special schools, nurseries and children’s centres.
Lancashire are a library service that have always been keen to engage with data projects; they understand their data, and want to do more with it. Carolyn Waite, the Information Development Manager has previously been involved in projects such as the Library Data Schemas, and round table data discussions with sector leaders.
When a user joins Lancashire Libraries, the library service requests a small amount of information: Name, Local library, Date of birth, Address, Telephone number and/or email address.
One of the most useful pieces of data for analysis is one that gives very little direct information: the user’s postcode. A postcode doesn’t describe an individual, but it tells us a lot about a place. In society, we still use the term postcode lottery to describe unequal provision of services such as healthcare and education, between different communities. There are also significant differences in socioeconomic status, ethnicity, age, and other demographics, between different areas.
When analysing members we don’t need to pry into their personal lives. Their income, education level, and health shouldn’t be collected or analysed. But we can analyse where people live, and look at the profile of those areas. It doesn’t mean that everyone who lives in that area is the same, but as long as we have a decent sample of people, we can start to gather insight.
Library membership and usage
When considering a ‘library member’ we shouldn’t limit ourselves to traditional definitions of usage. CIPFA library statistics collect the number of ‘active borrowers’ across library services. This excludes anyone who is using a library for other reasons: computers, ebooks, emagazines, etc.
While borrowing still remains the primary reason for library membership, we shouldn’t ignore other usage types. If we don’t consider other usage we miss opportunities for insight, and even simple cross-marketing.
If a service discovers it has communities who don’t borrow books, but seem to be using the library for other activities, that’s an opportunity to engage users when they are in the library. If a community seems to have little contact with the library at all, that may require further outreach activities outside of the library.
Lancashire libraries have strong data capability: Nick Wotherspoon, from the Lancashire County Council Business Intelligence team, was very familiar with the reporting capabilities of the different library databases and able to generate postcode lists for members with the following usage types:
- Active borrowers of physical materials
- Active PNET users (users of the public network computers)
- Active digital users (ebooks/emagazines)
These were all taken from Summer 2024. A May 2024 report from Libraries Connected Ebook lending in public libraries, provides some data for different usage types across 28 library services across England and Wales. This will provide a useful baseline comparison for some of the findings.
Exploring maps
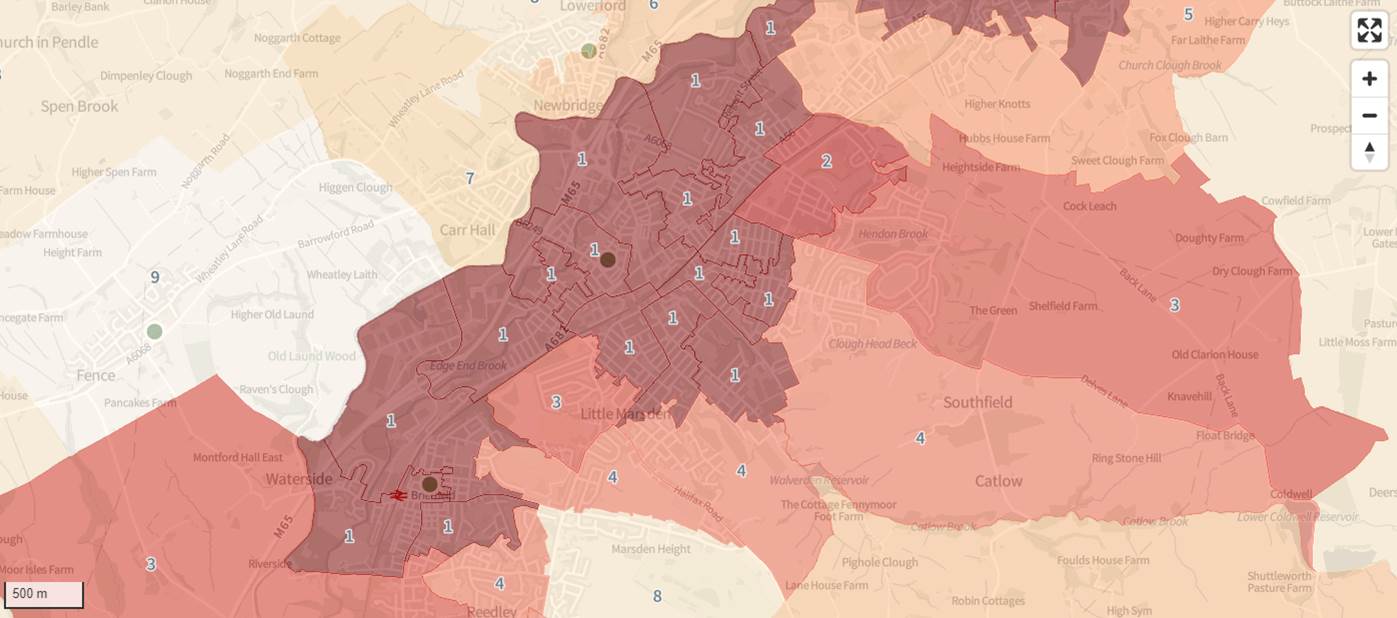
 Exploring digital maps of Lancashire. This one is set to highlight areas of high deprivation by shading them a darker colour and overlaying the deprivation decile measure.
We’re familiar with people using maps for exploration, but not so much for exploring data. Maps are a really useful way to gain insight from geospatial data (data related to places). It’s an instantly familiar visualisation method that can communicate the story behind data in a way that is intuitive - particularly for people who know the area in question.
Catherine Honnor, a library manager in Lancashire, did a brilliant job of transforming the postcode lists of membership types into counts per LSOA, while ensuring the postcode data was kept safe within the library service.
Catherine also gave up time to look at this data on a digital map, which plotted the different LSOAs in Lancashire, and shaded them to represent membership as a percentage of population. We also explored the map with the areas shaded by level of deprivation, which provided useful context. More importantly, Catherine was able to bring essential local expertise to the findings.
When doing any data analysis it is important not to do it in isolation, without involving subject matter experts. The majority of the findings needed expertise to either confirm that it matched lived experience, or in some cases warn against making assumptions that the data hinted at. A lot of the insight into the findings was also provided by Carolyn Waite.
Who borrows books?
Lancashire active borrower lists define an active borrower as a registered user with at least one physical format issue transaction in the last 12 months. The active borrower count is about 100,000 out of the total population of 1.2 million (8%).
When looking across different areas in Lancashire, the lowest numbers for active borrowers were 1% of the population, and the maximum 21%. It provided a really stark example of the difference in library borrowing between different communities.
Even with the low examples there are positives though. It’s encouraging to see there are no areas without any active borrowers. If you’re looking to increase usage in a community it’s good to have a starting point of some users in that area. Assuming about 1,500 people per LSOA, 1% would be 15 people who can promote the service. Perhaps a good opportunity for a refer a friend scheme?
It’s also a positive indication for the service that active borrowing can be greater than 20%. If all areas of the county got to that level, it would mean over doubling active borrowers. When you consider that there are also the other active membership types (events, ebooks/emagazines, PNET) it’s clear that the potential for library membership remains a high percentage of the population.
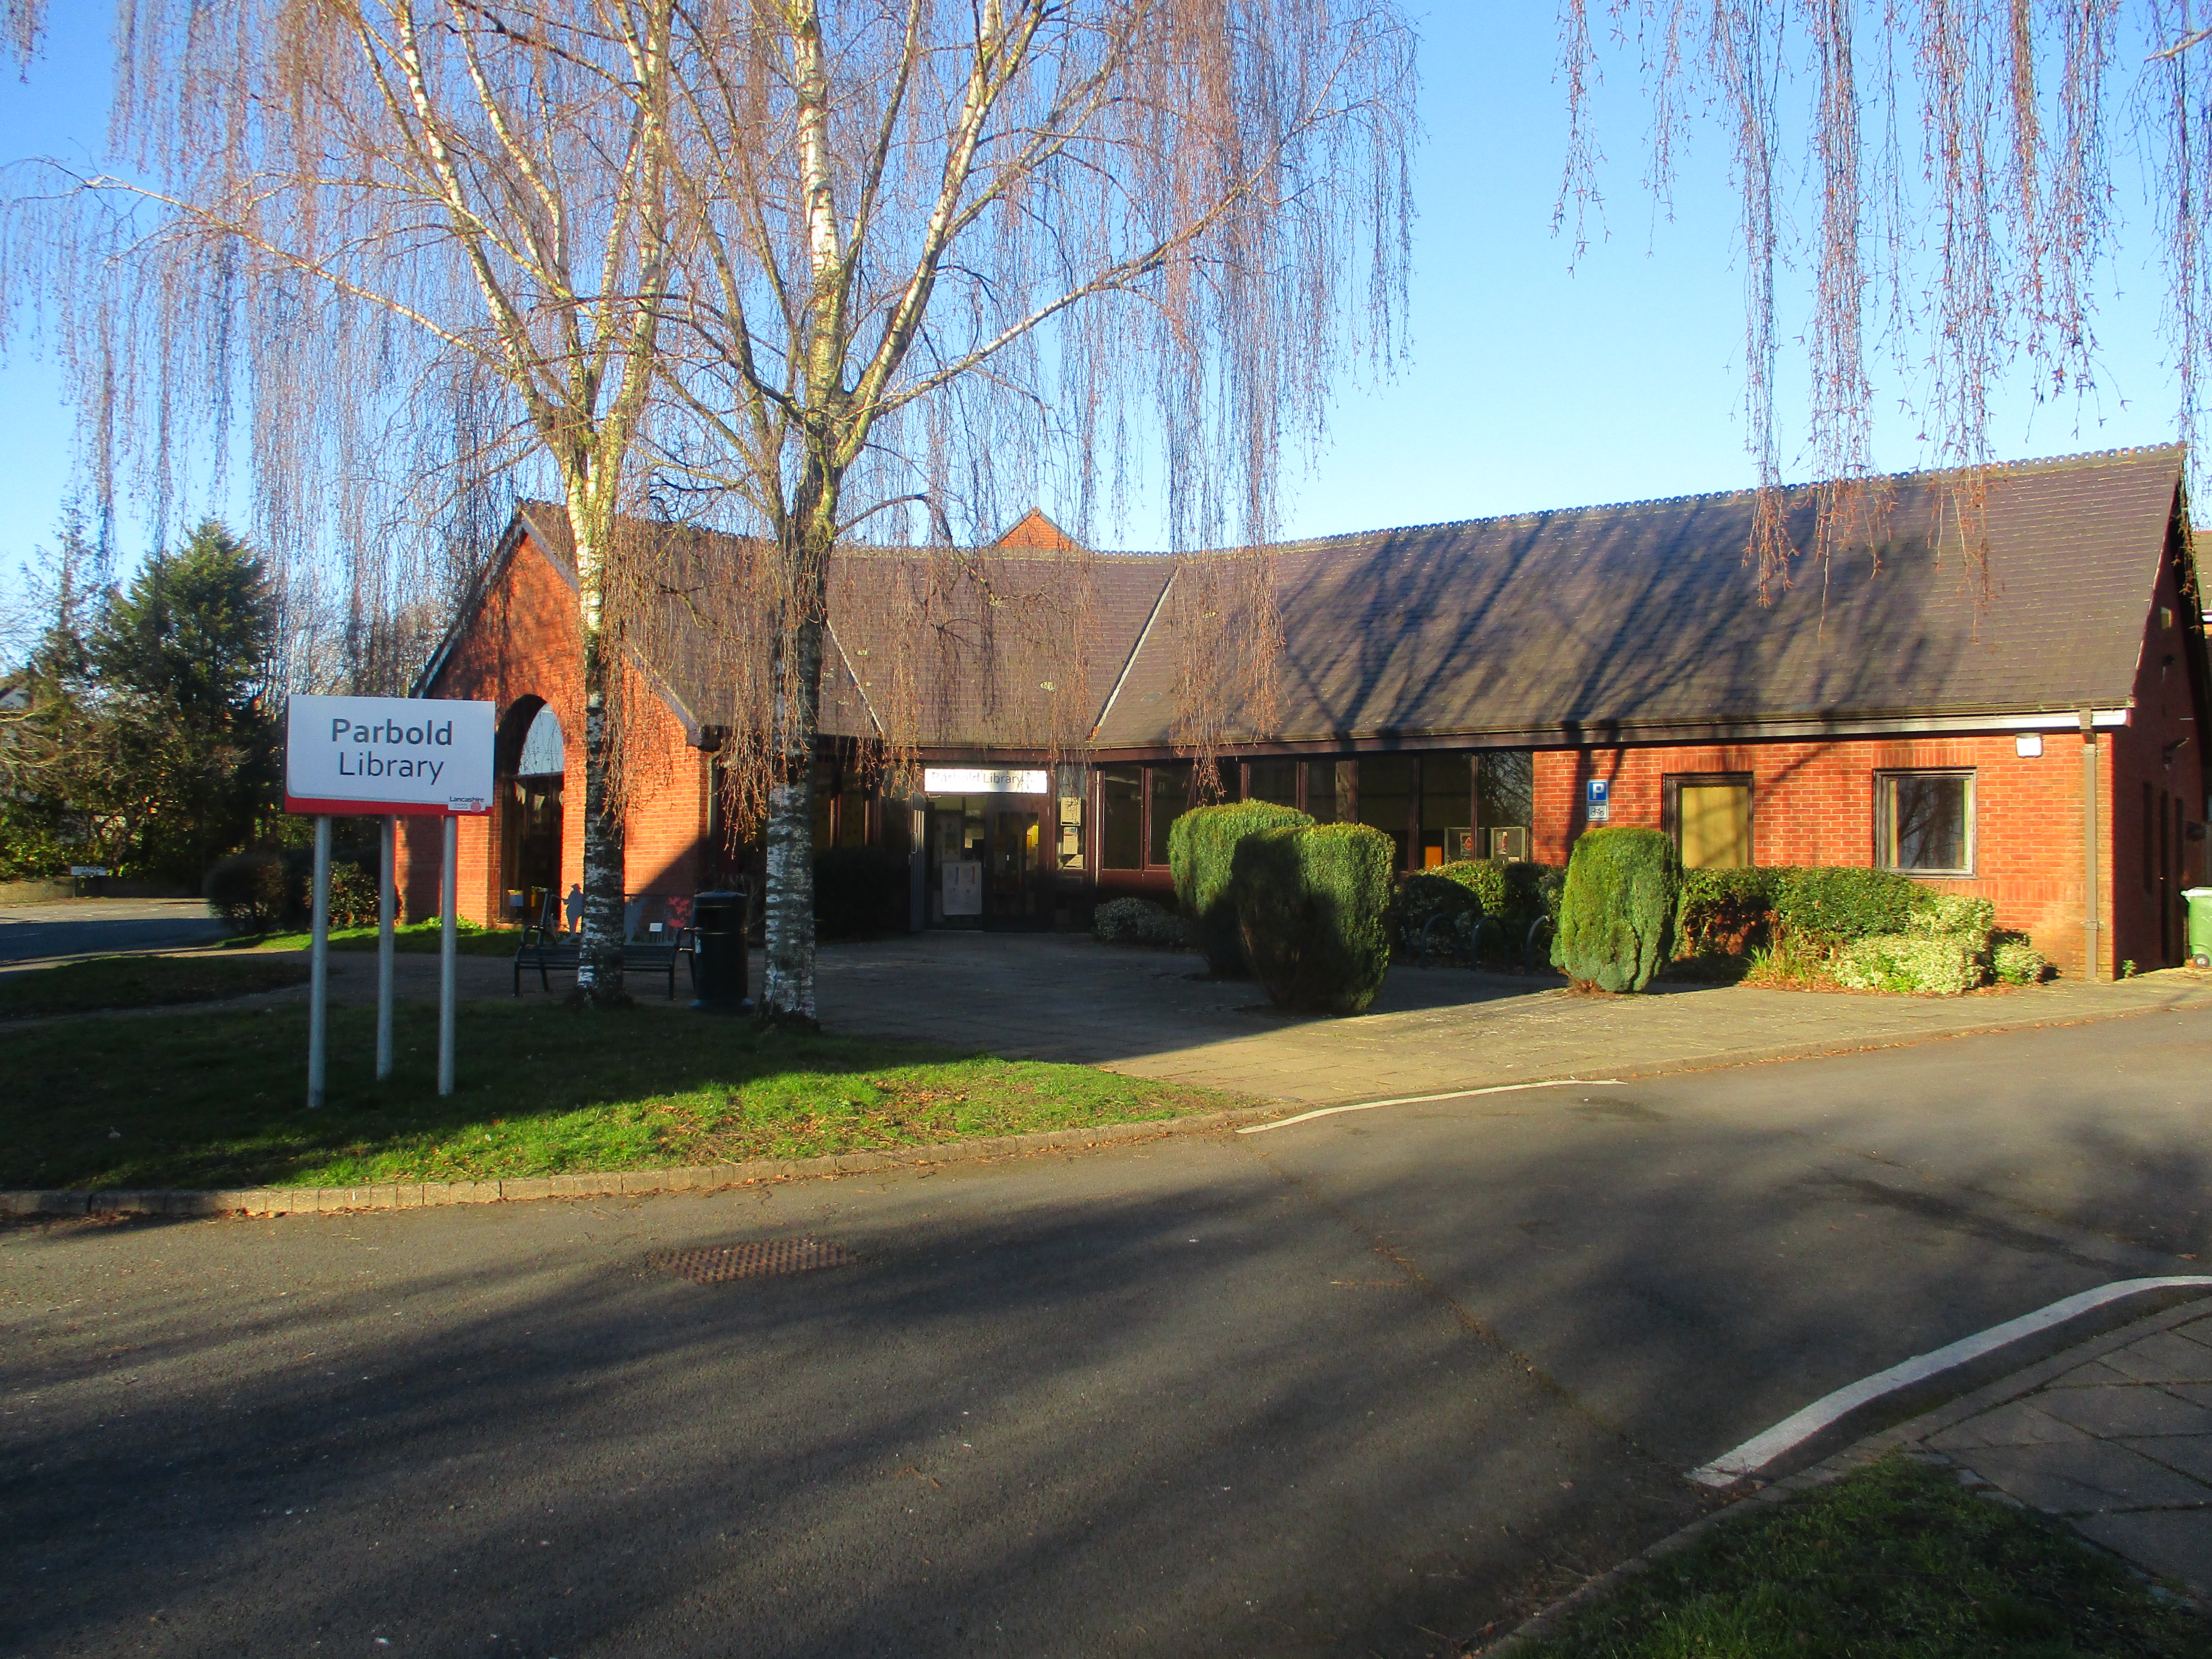
The area with 21% active borrowers is an LSOA on the south side of Parbold library. Other examples of this data analysis have also shown that usage peaks around local libraries. That sounds like it should be obvious, but it isn’t always reflected in policy. Policy can sometimes be driven by the fact people can reach a library, without necessarily having one in their immediate location. The data shows that the presence of a library increases usage. It was no surprise to discover that Parbold has a thriving library, with regular events, and open 5 days a week.
 The lovely looking library at Parbold. Photo provided by and copyright © Lancashire libraries.
We compared the spread of active borrowers across the different deprivation levels of the LSOAs, using the 1-10 decile values. We could see that this broadly matched the profile of the general population. This suggests that, in terms of borrowing, there isn’t a significant bias to favour either areas of low or high deprivation.
We also looked at usage across different measures of how rural/urban each LSOA is, to see if there were any significant differences. Although generally uniform, there seemed slightly lower active borrowing in the Major conurbation areas (the biggest towns). Lancashire has 6 mobile library vehicles with hundreds of stops - it’s highly likely this coverage across the authority helps to ensure that rural borrowing isn’t disadvantaged.
People using the computers
In Lancashire, PNET is the term used for the People’s Network computers. The People’s Network was a government initiative to provide free access to computers and the Internet in public libraries.
Analysing PNET usage has a slightly different context to analysing book borrowing. Library computer provision can be more about ensuring we meet the need of different communities rather than also seeing the broader positive outcomes from engaging with the library for reading (while knowing this is still essential for many people).
There were 47,000 active members who are PNET users. This seems high - it’s less than half the active physical borrowing counts but by no means a small percentage.
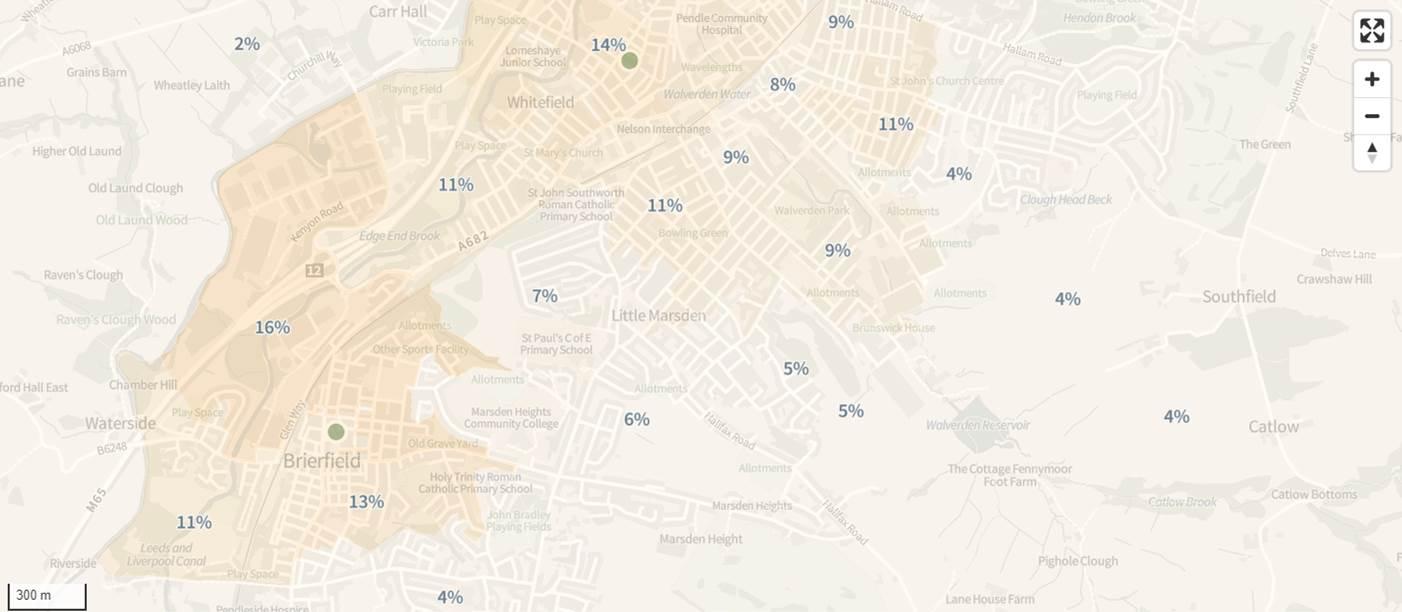
Across different LSOAs there is a significant range of usage: from 0% of the population in some areas, to 16% in another. The area with 16% active PNET members is an area called Brierfield. Brierfield is an area of high deprivation, as well as having a high population of non-white ethnicity (38% Asian and 36% Muslim).
 Brierfield PNET Usage. The map is set to highlight in darker shades the areas of greater % of the population using the PNET. This varies from 0% to 16%.
We looked at how PNET usage varied across different deprivation measures. 30% of all PNET users were from areas with a deprivation decile of 1 (areas in the 10% most deprived in England). This clearly showed that PNET users are not just likely to be from deprived areas, but from areas of the very highest deprivation.
To some extent this is proving an ‘obvious’ point. Most people would guess that people in highly deprived areas are more likely to make use of library computers, and the Internet available in libraries. But it is important to back this up with data. In our example of Brierfield, all the LSOAs around that area had a deprivation index of 1 (highly deprived), with one area showing PNET usage of 16% of the population. This not only proves that areas of high need require computer provision, it demonstrates the library service clearly meeting that essential need.
The majority of PNET users were from urban areas, tending towards towns and cities. This was actually slightly down in the most urban areas (Major Conurbations). Again, this is where local knowledge was essential - Preston library had been temporarily closed with reduced PNET provision and usage, and it is likely this would have skewed the usage statistics.
People reading on their devices
There were 30,000 active ebook/emagazine users. Like PNET usage, this is fewer than physical lending but still a significant number. For context, the Libraries Connected report said that an average of 7% of registered library users are ebook borrowers. That’s a slightly different measure as we’ve split up usage types, but Lancashire show high numbers of users registered with digital services.
Again, we saw a significant variation between different areas - going from 0% in some neighbourhoods, to 8% in another, with an overall average of 2% of the population.
Usage looked to be less in areas of high deprivation. If users in those areas are more likely to use library PCs and Internet then they are less likely to have their own devices with which to borrow ebooks. Plus the type of digital activity is likely to be different.
A useful word of caution provided by Catherine was that we should consider that ebook/emagazine users in deprived households could be sharing devices, and also library accounts. A highly affluent household may have multiple accounts and devices. This would skew the figures of ebook users more towards less deprived areas, but misleadingly so.
Knowing that there is less take up of the digital services in deprived areas could inform an action to market to users in those areas for services like mobile data schemes or tablet borrowing, which would allow them to use the Internet as well as having access to ebooks and emagazines.
High levels of ebook usage seemed to be centred around bigger libraries. It was suggested that this could be due to digital champions in those libraries, or more focus and signage pointing people towards the ebooks service. This provides an indication that a physical library service can still significantly increase digital usage.
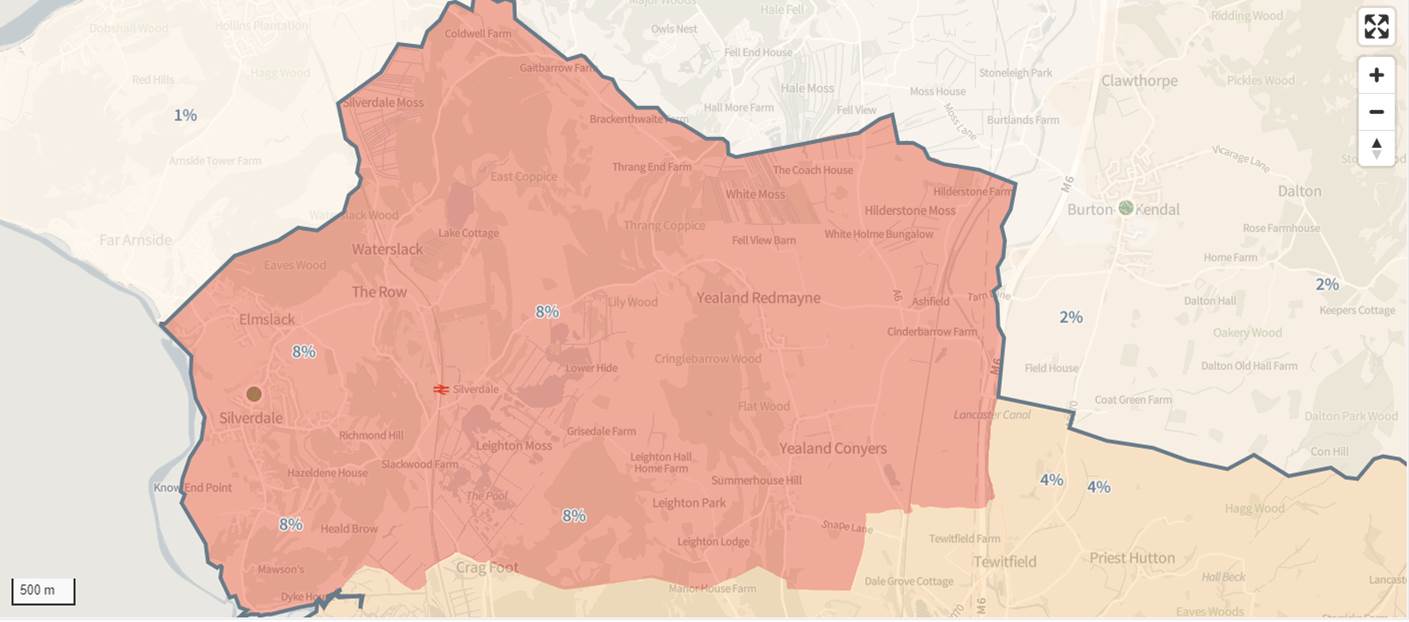
The area with really high usage (8%) is Silverdale, a small affluent village. It is likely that a lot of residents speak to each other and will want to support their local amenities i.e. the library. There will also be a high level of households having devices to enable e-book/audio, and residents will have a high level of educational attainment and literacy. We can see this from the deprivation indicators where Silverdale has a multiple deprivation index of 9 - putting it amongst the 20% least deprived neighbourhoods in England.
 Silverdale ebook/emagazine usage. The map is set to highlight in darker shades areas of greater % of the population using ebooks and emagazines. In Silverdale this reaches 8% of the population.
Usage of these digital services is slightly higher in rural areas than urban areas.
Watching change over time
That was a snapshot of usage from the summer of 2024, but additional insight can be gained from observing how things change over time.
We looked at a single type of usage (ebook/emagazine) and differences in the user registrations over two different timescales:
- Between April 2019 and March 2020
- Between April 2020 and March 2021
Those timescales give us a look before Covid-19 and then during it. One of the impacts of Covid for libraries was the shift to digital borrowing. There remain a lot of unanswered questions - did those who registered for the ebook service during Covid match a similar profile to those who were registering previously? Was there truly a ‘shift’ to ebooks, or did it just accelerate the takeup for those users who would already be more inclined to use the service?
Firstly, the main takeaway was that the numbers were small, and it was difficult to spot anything that would give detailed insight.
| Year | Ebook registrations |
|---|---|
| 2019-2020 | 2880 |
| 2020-2021 | 3943 |
There is a significant increase in registrations (37%), but still overall low numbers. We mapped both sets of years across the County to see if there were clear patterns or ‘hotspots’ of registrations.
In 2019-2020 we didn’t see any clear patterns. At most the registrations amounted to 1% of the population of a single LSOA, which would be around 15 people.
In 2020-2021 there were more areas that had higher registrations, though still only a maximum of 2% of the population. We found these were spots around the ‘Band A’ libraries (bigger libraries in big towns). The spread of registrations was otherwise uniform.
In both of the years a greater proportion of rural populations took up digital services. While that echoed what was visible in the overall ebook user base, seeing it appear in consecutive years gave us a consistent pattern, rather than something that could have been caused by an anomaly of a particular year or programme.
The classification of an area as being rural is often used as a measure of digital exclusion/deprivation, so it was useful to see that there doesn’t appear to be a significant rural/urban divide in the usage of library digital services. That could be because being rural isn’t a valid measure of digital exclusion in Lancashire. Or it could only apply to small numbers of people. With library digital users only being a small number within an area, it’s harder to detect patterns of people that are excluded. If usage continues to increase then keeping an eye on that proportion between rural/urban will be important.
It’s another postive indication for the library service that rural take-up of ebooks and emagazines is healthy, and shows that there is good communication to rural areas, including a significant mobile library service.
Conclusion
- Active borrowing is uniform across different deprivation levels, showing it remaining a universal service able to attract people from any background
- In some areas active borrowing rises to 21% of the population, displaying a potential to be very high
- 30% of registered PNET users reside in areas of the very highest deprivation. In one deprived neighbourhood in Brierfield, 16% of the population are PNET users. A clear display of need being met by library services.
- Ebook/emagazine usage is slightly lower in areas of high deprivation
- Ebook/emagazine takeup is slightly higher in rural areas
- There is great potential for increase in digital lending - with one community in Silverdale seeing 8% of the population being active users but 2% being the average
As with any data analysis, the more you delve into it the more questions it raises!
Exploring membership in small communities has been a useful way of visualising different types of library usage, and of understanding some of the differences between those communities.
It would be possible to permanently embed such capability, with the maps being updated regularly from automated fresh data extracts. Potentially this would be very powerful tool for a library service to monitor and target gaps of library engagement.
All maps in this data story contain Ordnance Survey data © Crown copyright and database right 2025